
World Data Lab · Cities
Consumer spending doesn't distribute evenly across a country. It concentrates in cities.
National averages collapse hundreds of city-level realities into a single number. That number is true. It is also almost never the right one to act on.
How we define a city
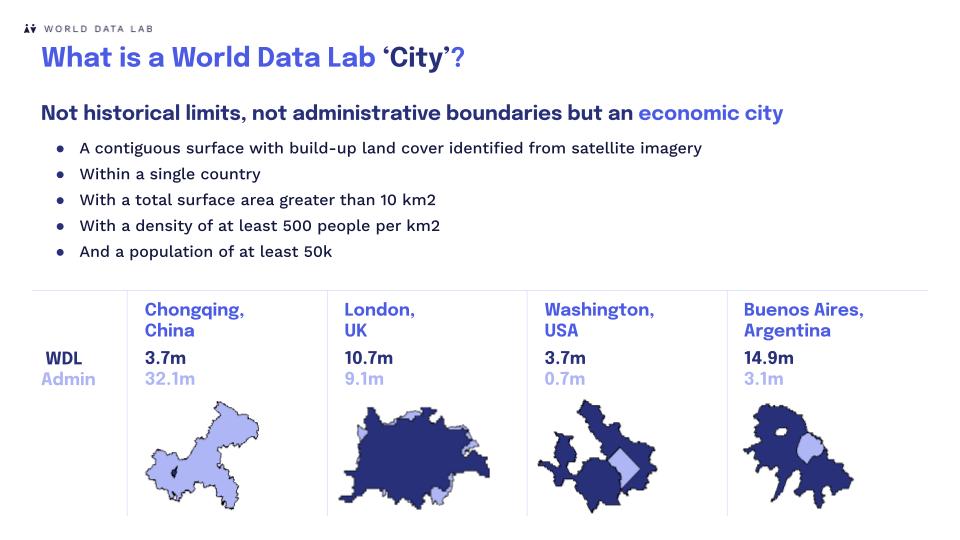
A city isn't an administrative boundary. It's the population that can participate in a market.
You cannot plan a city strategy while looking at administrative boundaries. Every country defines a city differently, rendering city data incomparable for companies planning global strategies.
At World Data Lab, we leverage satellite data to assess built-up population concentrations, so insights are comparable across markets.
Defining cities by economic activity - not administrative lines - helps our clients capture their true addressable market.
Where spending actually sits
The variation within a region matters as much as the variation between them.
Consumer spending varies more between cities in the same country than between regional averages. Two cities in one national economy can be further apart on this chart than cities on opposite sides of the world.
How markets concentrate
At premium thresholds, city coverage is market coverage.
- At low spending thresholds, significant consumer populations sit outside tracked urban centres.
- As thresholds rise - toward $45, $90, $130 a day - the qualifying population concentrates sharply into cities.
- Above the upper-middle threshold, city coverage accounts for the majority of the addressable market globally.
- The concentration differs by region. In APAC, secondary cities carry a growing share of the next tier of entrants.
Global coverage
We break down cities from premium to mass-market opportunities.
Most city datasets give you a snapshot. Ours gives you a trajectory. We track how spending power has shifted since 2000 and where it's heading through 2040 - at the city level, across every income threshold, for every market we cover.
Addressable premium spend
Knowing where rich consumers live is not the same as knowing if they can spend.
We analyse costs of living to determine a consumer's true spending potential. Housing, health and transport absorb different shares of income depending on the city - what remains for discretionary spending varies sharply even between cities at the same income level.
The ranking by addressable premium spend is a different list from the ranking by income. A brand that selects target cities by income and one that selects by discretionary share will often find themselves in different cities.
Getting this wrong means either overstating the opportunity where essentials crowd out premium spend, or missing cities where high discretionary share makes the addressable market larger than headline incomes suggest.
Keep exploring
City data connects to the rest of the platform
Every city figure comes from the same harmonised model behind World Data Intelligence, and every city can be cut by any of our 200+ spending categories.
Free download
Get the cities slide download.
A sample of city-level consumer spending projections so you can see the granularity before you commit.
- Sample city rankings
- Category splits per city
- Projection notes and methodology
Plan your city strategy on comparable data.
Explore consumer spending across 9,000+ cities in a single harmonised dataset - from 2000 through 2040.